Connect HAProxy databases to PMM
Monitor your HAProxy load balancer performance with Percona Monitoring and Management (PMM). PMM collects metrics from HAProxy’s built-in Prometheus endpoint to provide insights into proxy performance, backend health, and traffic patterns.
Prerequisites
Before adding HAProxy to PMM, ensure:
-
HAProxy configured with metrics endpoint.
- HAProxy must expose Prometheus metrics. See How to configure HAProxy.
- Default metrics endpoint:
http://localhost:8404/metrics - Verify metrics are accessible:
curl http://localhost:8404/metrics
-
PMM Client installed and configured
- PMM Client (pmm-agent) running on the same host as HAProxy
- Node registered with PMM Server using pmm-admin config
Add HAProxy service
Add HAProxy monitoring with the required port specification:
pmm-admin add haproxy --listen-port=8404
where listen-port is the port number where HAProxy is running. This is the only required flag.
Successful output
HAProxy Service added.
Service ID  : c481183f-70a2-443f-91e5-cae5cecd06a2
Service name: Ubuntu-haproxy
Advanced configuration options
Customize the HAProxy service with additional parameters:
# With authentication
pmm-admin add haproxy --listen-port=8404 --username=pmm --password=pmm MyHAProxy

# With custom metrics path and HTTPS
pmm-admin add haproxy --listen-port=8404 --metrics-path=/prom-metrics --scheme=https

# With custom service name
pmm-admin add haproxy --listen-port=8404 Production-HAProxy
Available options
--listen-port: HAProxy metrics port (required)--username: Basic authentication username--password: Basic authentication password--metrics-path: Metrics endpoint path (default: /metrics)--scheme: Connection protocol (http or https)--skip-connection-check: Skip connectivity validation
Via web UI
To add HAProxy through the PMM web interface:
- Go to PMM Configuration > PMM Inventory > Add Service.
- Select HAProxy from the service types.
- Configure the connection parameters then click Add Service.
Verify the connection
Check that HAProxy monitoring is active:
pmm-admin status
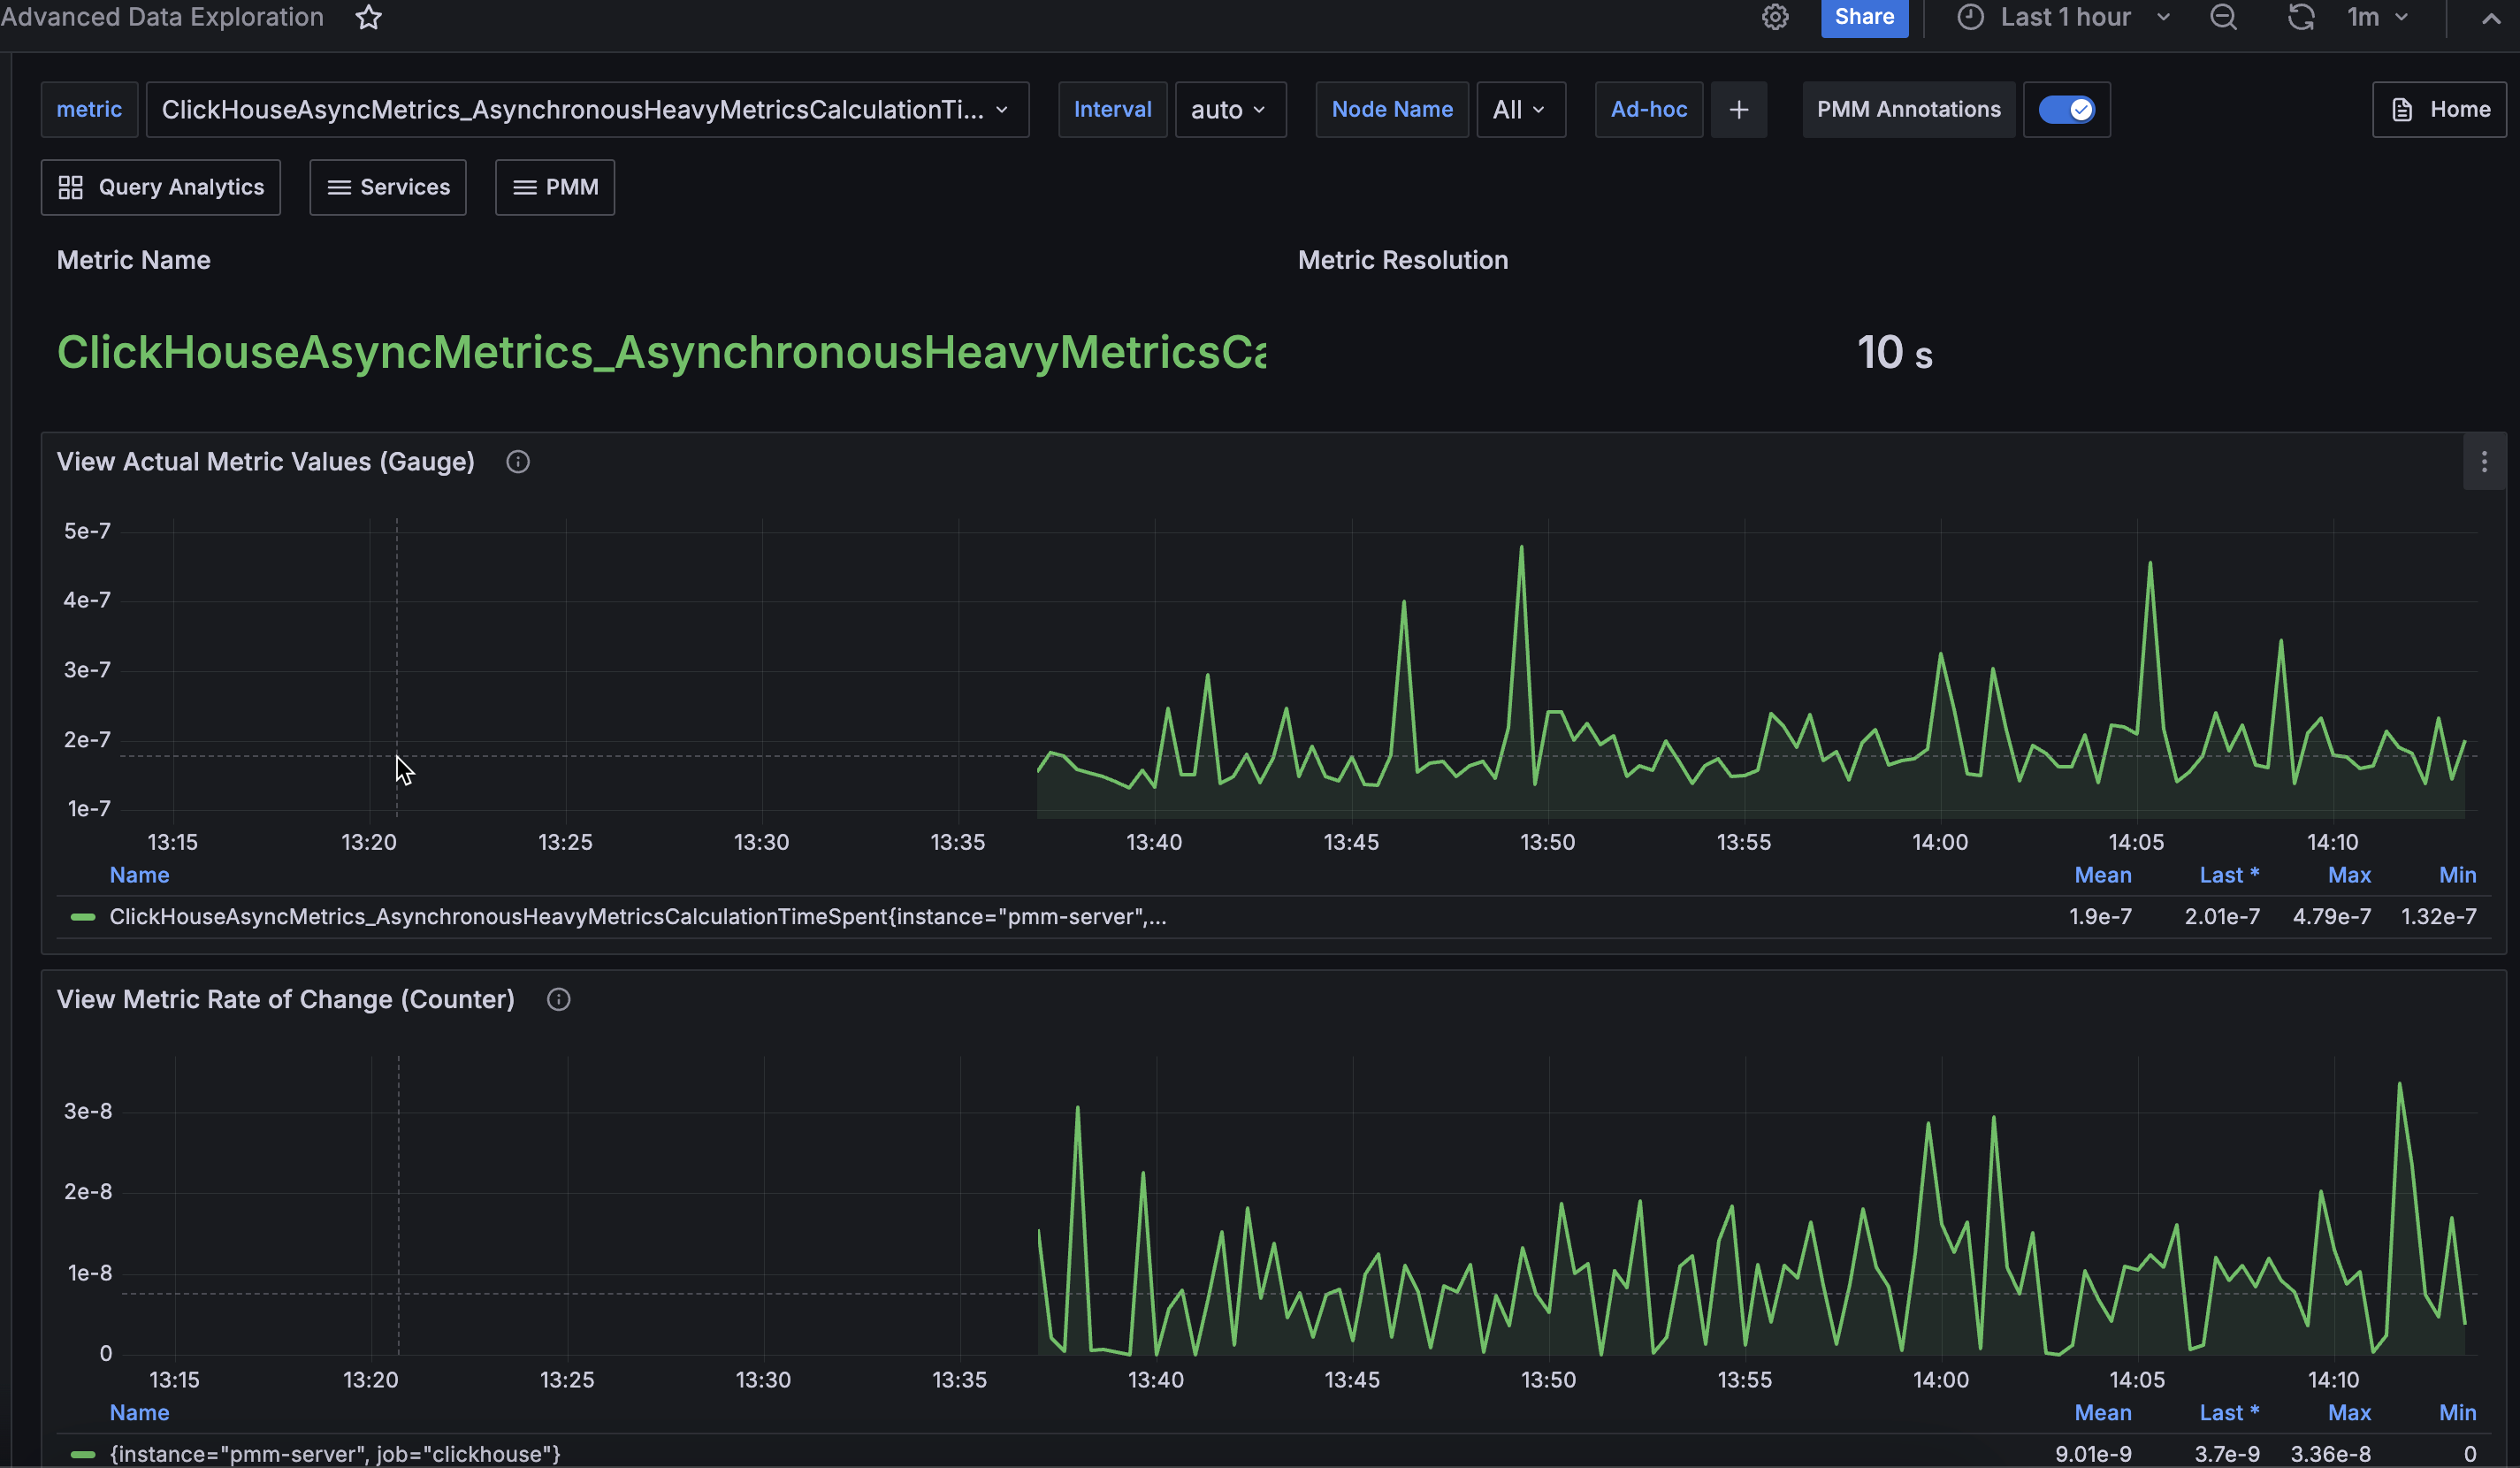
HAProxy data is visible in the Advanced Data Exploration dashboard:
